Find your place in the universe
STEMarts Lab prepares youth for bright futures and connects them to a universe of possibilities through international sci-art experiences and mentorship programs in art, science, and technology.
What’s Happening Now
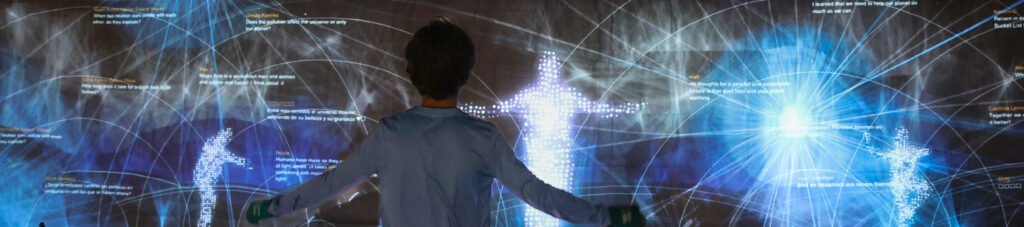
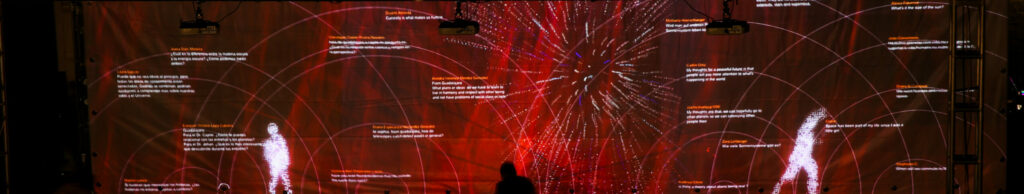
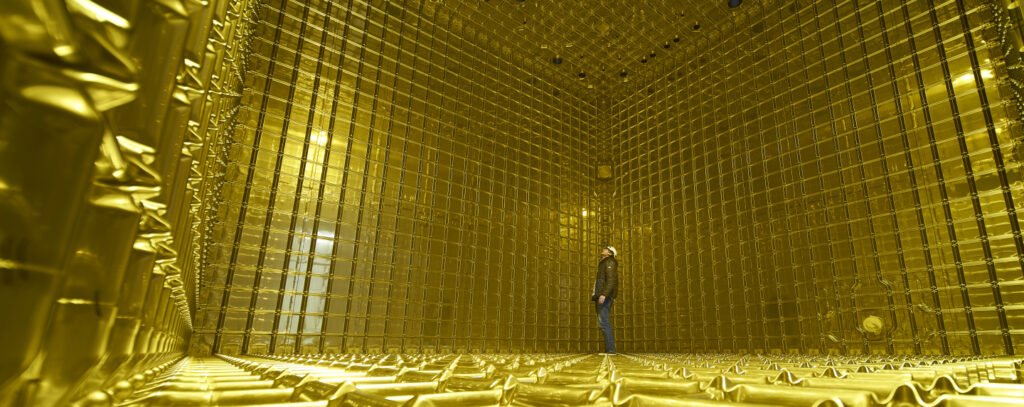
STEMarts’ current project, Space Messengers, is a traveling mixed reality installation. Students become part of our professional team of artists, scientists and experts, as we explore the universe from diverse interdisciplinary perspectives.
Get Involved
Youth
Discover a world
of opportunities
Educators
Explore free
resources
Partners
Collaborate with
our team
Stories
- Invent Event a success!
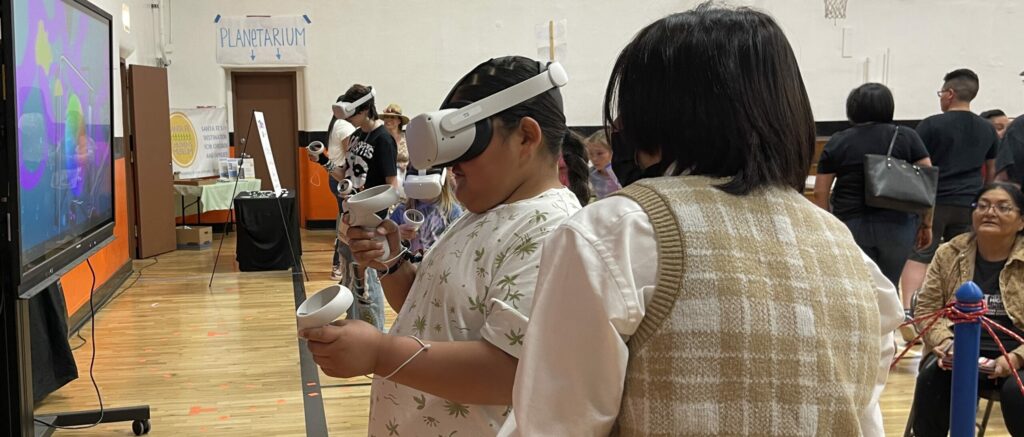 Shout out to Twirl Playspace for another fun and successful Invent Event! STEMarts Lab hosted an interactive VR station… Read more: Invent Event a success!
 - Savannah Romero steps up as Research Assistant
 Savannah Romero, alongside five other winners from Northern New Mexico, clinched the STEMarts Apprenticeship award this year. Since January,… Read more: Savannah Romero steps up as Research Assistant
 - Getting Ready!
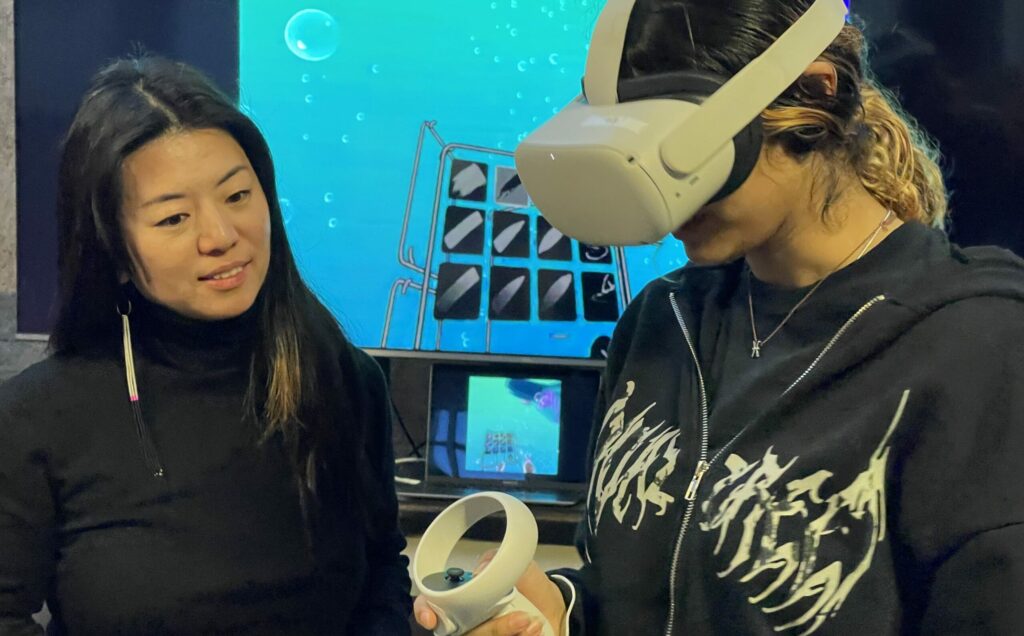 We are gearing up for the VR Live Painting station at Invent Event! Artist, Izumi Yokoyama and the STEMarts… Read more: Getting Ready!